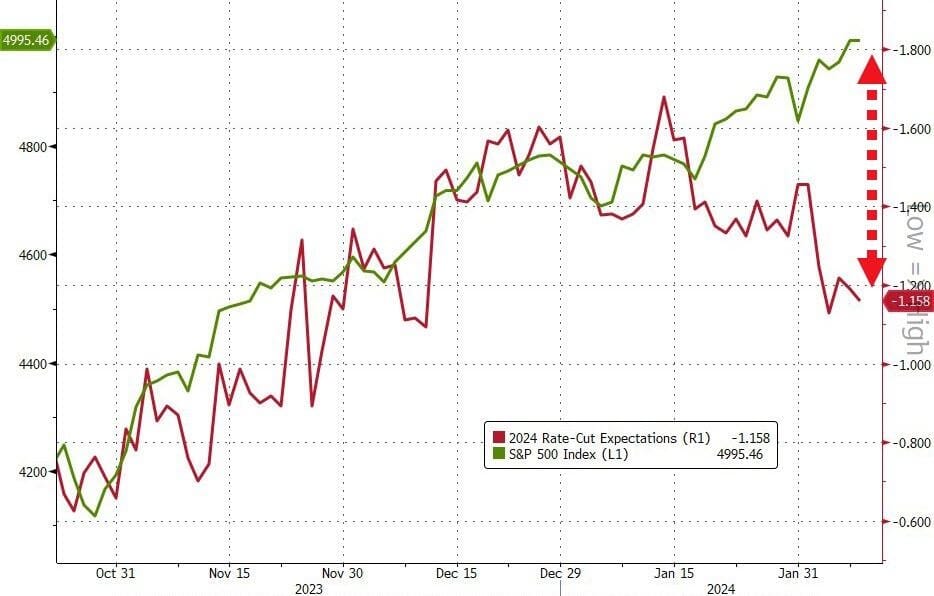
So US Jobless claims just won't quit and were enough to send Treasury yields higher overnight, while rate-cut expectations still drifted lower but US stocks hit a new record high...
Source: Bloomberg
and the S&P 500 did crack intra-trade 5,000 pts in the overnight session.
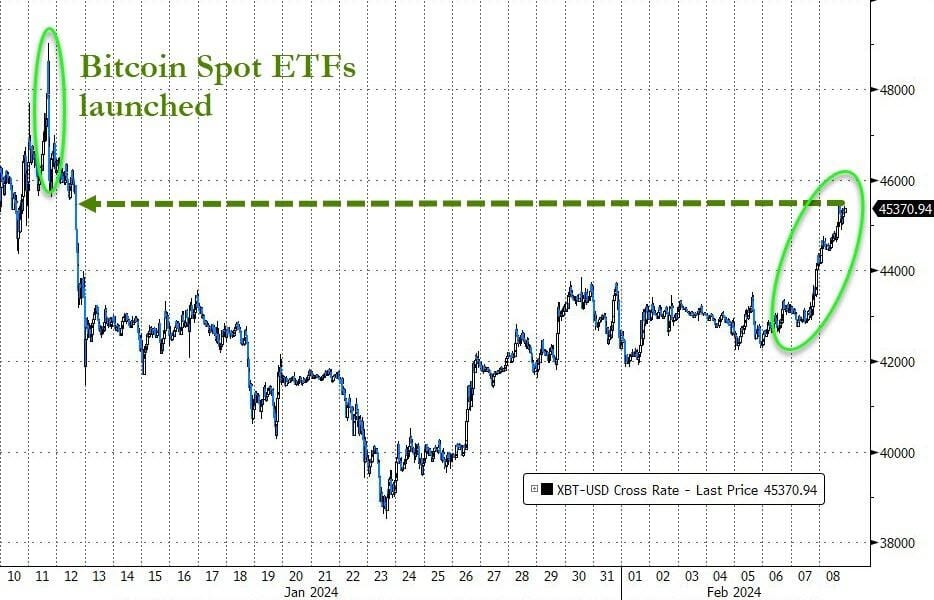
Meanwhile, Bitcoin surged back above USD$45,000 overnight...spot at the time of writing this report USD$45,367 of AUD$69,892
Source: Bloomberg
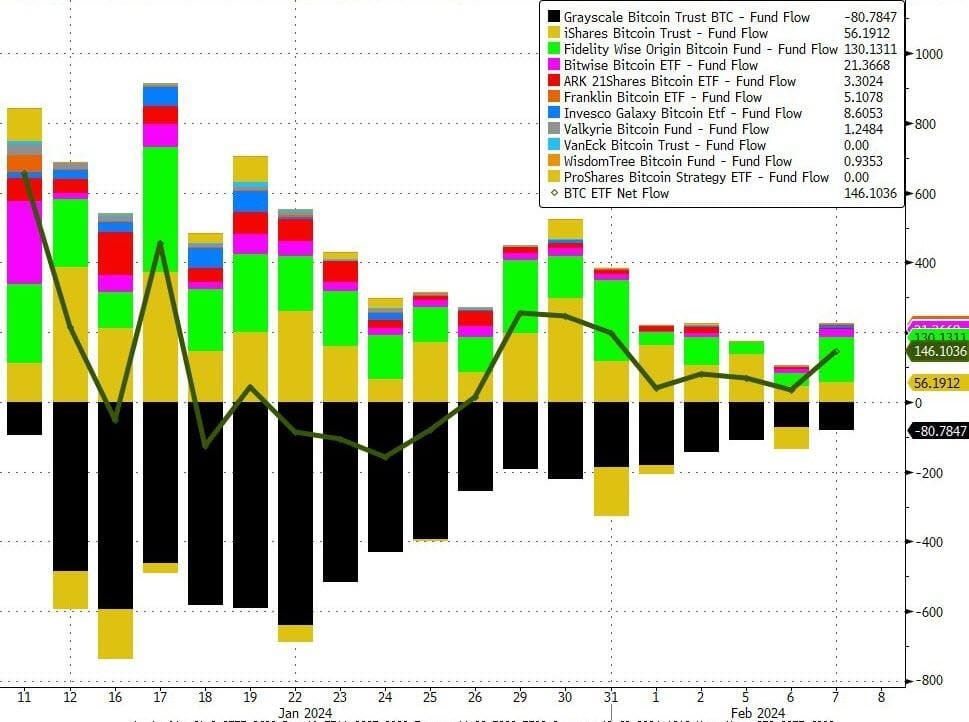
all driven it seems after yet another strong day of net inflows to spot bitcoin ETFs...
Source: Bloomberg
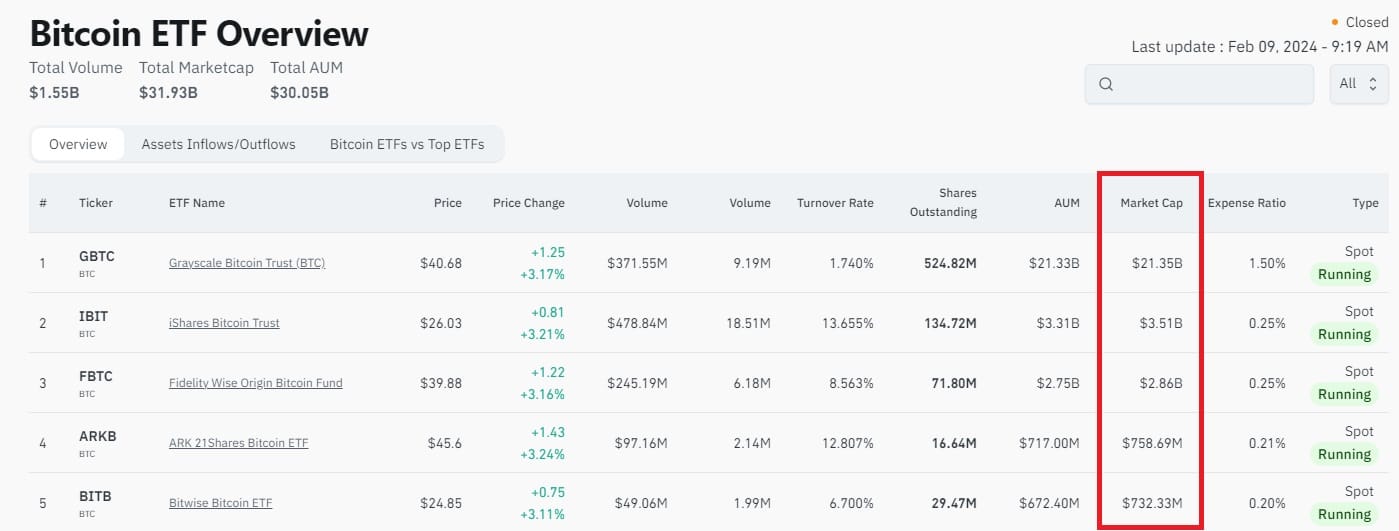
GBTC is still the 900 pound BTC ETF Gorilla but Blackrock's IBIT ETF is impressive at USD$3.5bn mkt cap in such a short time.
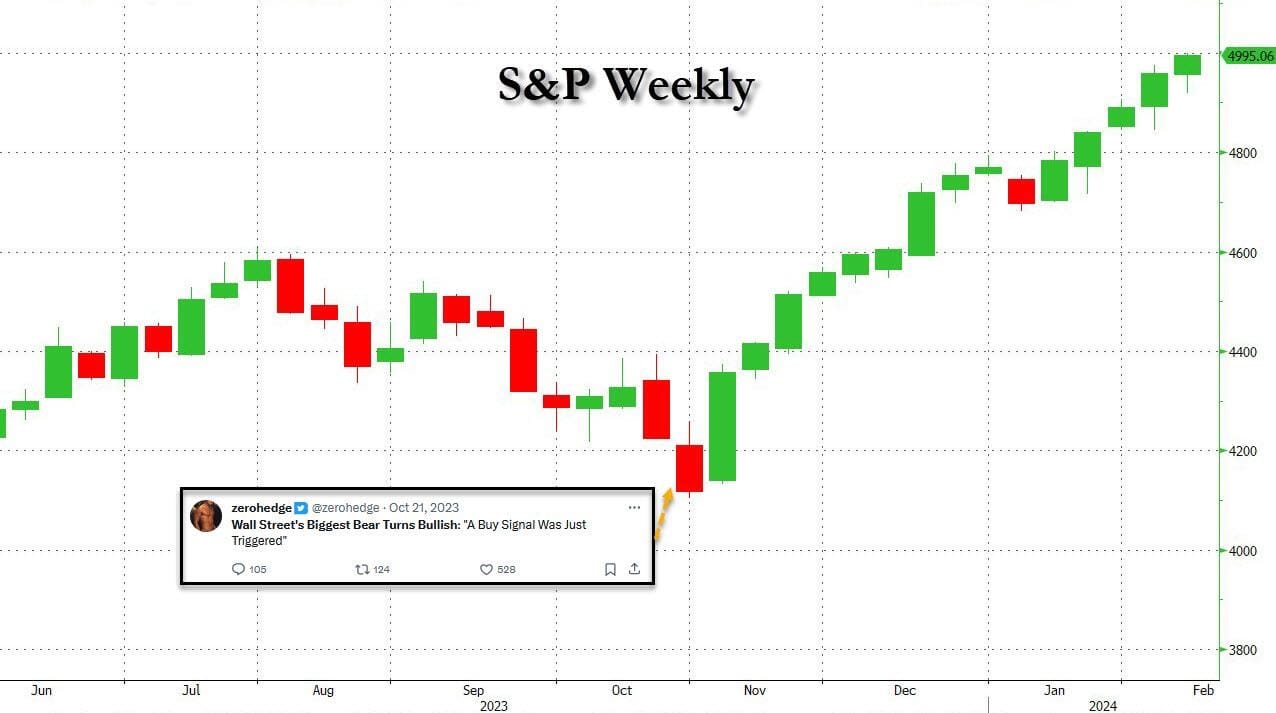
Now this is truly fascinating. Since the OCT2023 mkt lows, I was surprised to learn that the S&P500 has risen 13 of the past 14 weeks, and unless the bottom falls out of the market in the next 2 days, we are looking at 14 out of 15 green weekly candles in the S&P...
Source: Bloomberg
... which would be the longest such streak in 52 years: the last time we saw anything similar was in the 4 month period between Nov 1971 through February 1972.
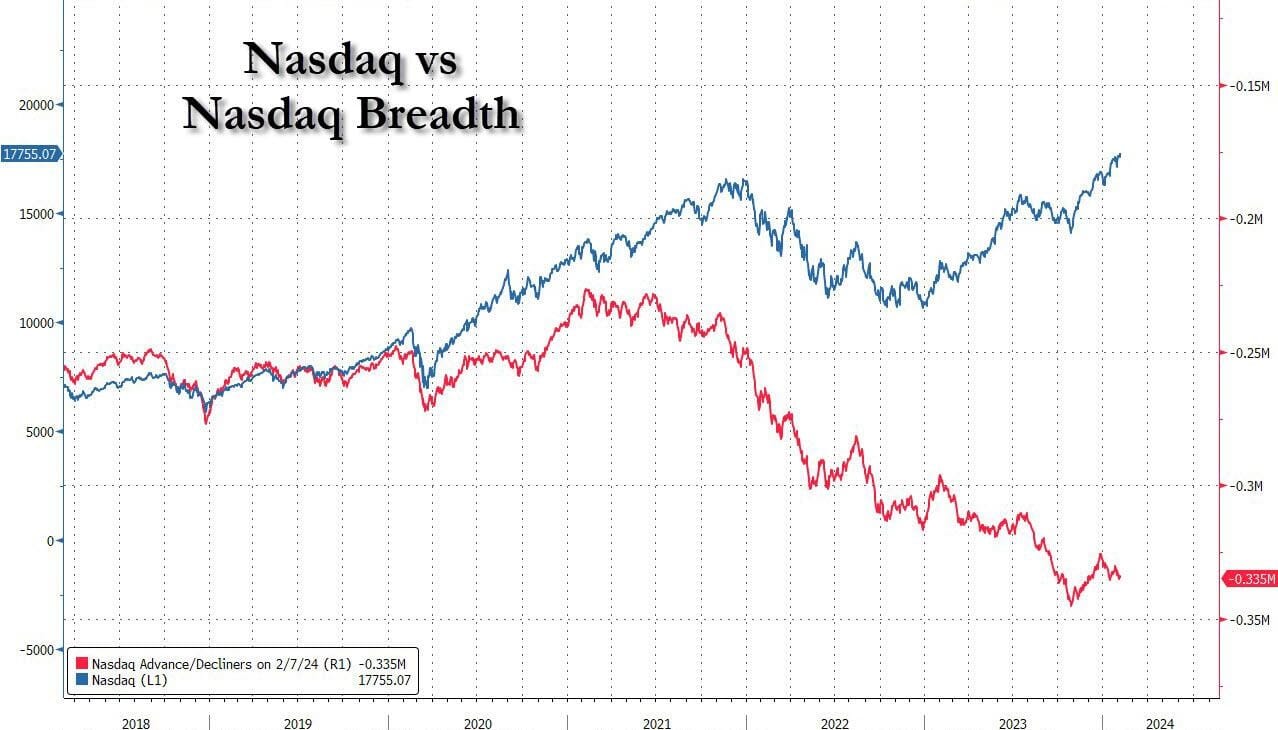
But we do have a problem - Mkt Breadth.
Record divergence between the Nasdaq (which is at all time highs) an d the Nasdaq Advance/Decline line (which is near record lows) makes all too clear.
Source: Bloomberg
the meltup over the past 4 months has been largely led by tech in general, and by the Mag 7 in particular (or, the Fab 4AMZN, MSFT, NVDA and META to be even more precise, now that the remaining three members of the Mag 7, GOOGL, AAPL and TSLA appear to be relegated to the Meh 3), with the rest of the Nasdaq declining and the equal-weighted S&P unchanged since late December!
And this observation from Sentiment Tracker is just mind boggling.
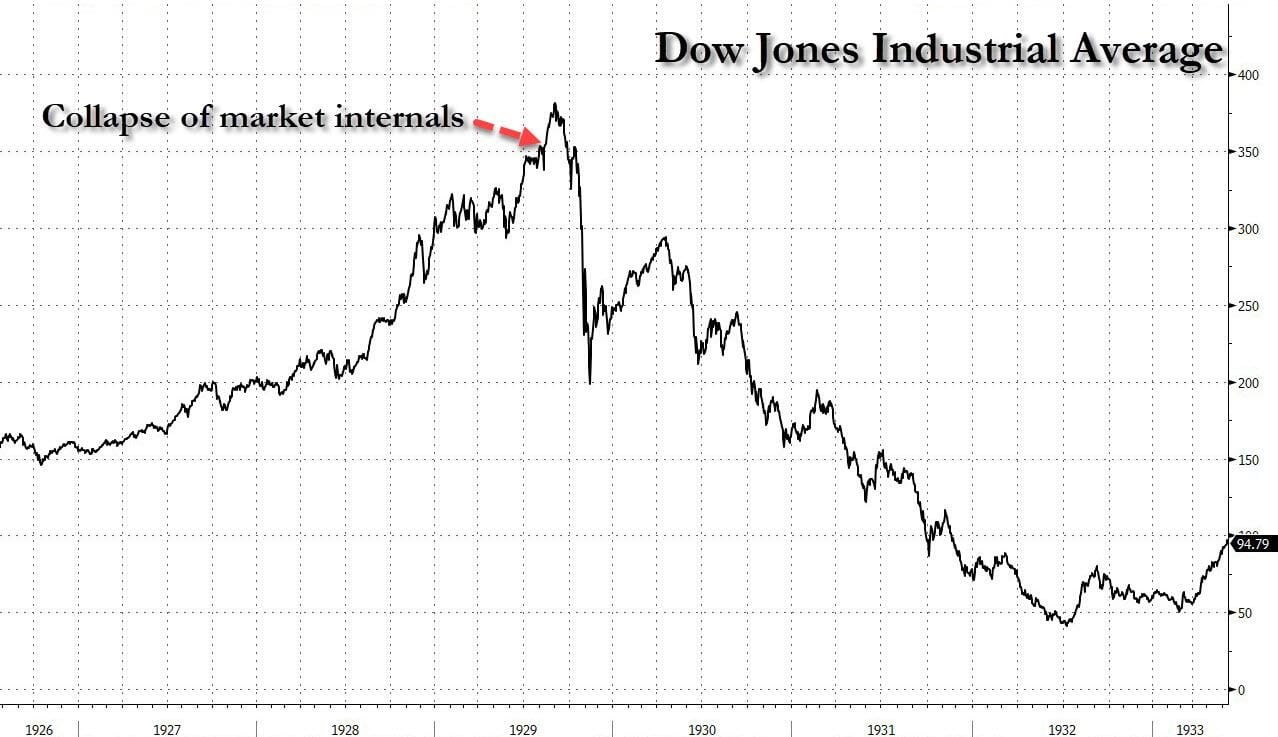
The S&P 500 is within .35% of a 3-year high" and yet "fewer than 40% of its stocks are above their 10-day avg, fewer than 60% above their 50-day, and fewer than 70% above their 200-day.
Why is this notable? "Because since 1928, that's only happened once before: August 8, 1929." Everyone knows what happened next.
So yes, the erosion in market breadth and internals can - and probably will - continue for some time. But when it does finally strike, the move lower will be brutal and instant.
Don't say you weren't warned...
Happy Friday!
Sign up for the Andika Bulletin
Find freedom. Create wealth. Build a better life with the Andika Bulletin and Confidential Daily.
No spam. Unsubscribe anytime.
This information contains unsolicited general information only, without regard to any individual’s investment objectives, financial situation or needs. It is not specific advice for any particular investor or trader. Investment in the stock market involves risk.
This information may not take into account your investment objectives or financial situation, and you should obtain advice based on your own individual circumstances before making an investment decision.
This information is made available to you by ANDIKA Pty Ltd ABN 41 117 403 326, a licensed securities and derivatives dealer (AFSL # 297069).
Andy is the founder of ANDIKA Pty Ltd, a licensed securities & derivatives dealer. He's the author of fiction and non-fiction books and has been a University lecturer on risk and investment.