

Politics & Current Affairs
Weather for power. Wages for tax.
I read 352 pages of the IGR so you don’t have to
I read 352 pages of the IGR so you don’t have to

A global fuel shortage could hand governments the keys to your daily life.

Alex Antic’s grassroots victory offers the Liberals a lifeline, but overturning it would turn renewal into revolt.
I read 352 pages of the IGR so you don’t have to

I have read 352 pages of the IGR so you don’t have to.
Treasury dropped the 2026 Intergenerational Report on 21 September. Three hundred and fifty-two pages of “we’ve got this.” I went through it chapter by chapter. The short version: they banned the options that would change the residual, then sold the residual as physics.
Start with the economy they want you to believe in. Chart 7.2 says real GDP per person will be 59% higher by 2065–66, growing at 1.2% a year against 1.5% over the last forty. That 1.2% is already after inflation — you don’t subtract CPI from it and call people poorer. What you can say is they just admitted the next generation gets a smaller lift than the last two, and they need forty years of no bust and a working grid to get even. Lately, GDP per head has been crawling at about 0.8% in 2025–26, and in some years it went backwards. Housing in the CPI is still running around 5%. Average living standards on paper; a house and a power bill in real life.
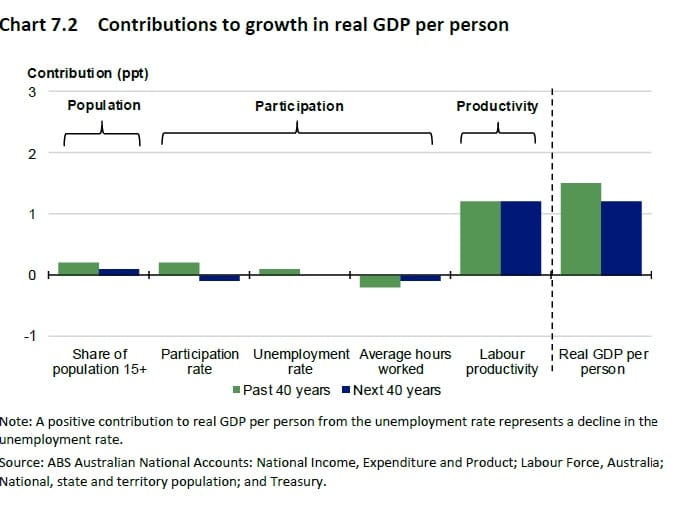
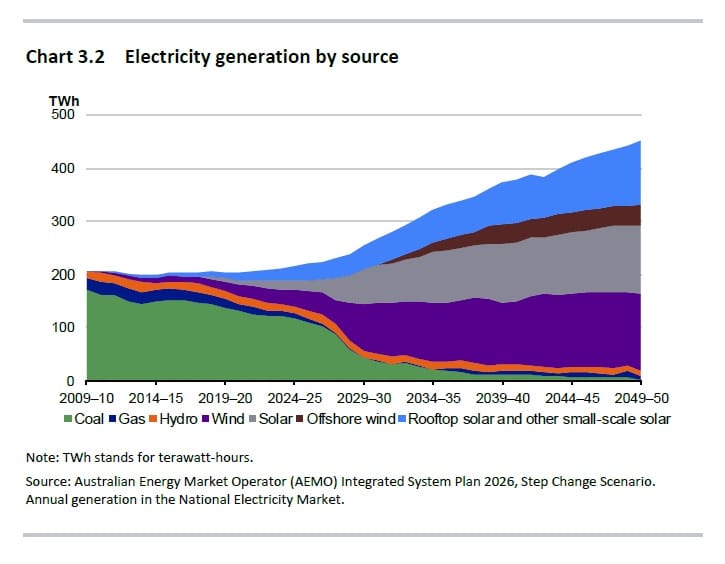
Chart 3.2 is the tell for the whole book. Stacked generation to 2050: coal falls off a cliff, gas and hydro are a sliver, and the big blocks are rooftop solar, utility solar and onshore wind. No nuclear bar. AEMO doesn’t plan for nuclear. They assume the weather turns up at design capacity. Data centres do not run on that. Microsoft leased Three Mile Island for twenty years. Oracle’s Project Jupiter in New Mexico is still being poured — on-site Bloom fuel cells, natural gas — not a finished Oracle campus someone labelled Jupiter on Facebook. xAI’s Colossus is gas. Australia has a nuclear ban, so the “abundant renewable potential” line in the AI chapter is a brochure. Firmus, NEXTDC, CDC and the Queensland 1.4 GW announcement are real pipeline. None of them is a 2.5 GW behind-the-meter factory on the pad. Pinning 24/7 AI load on rooftop solar is how you can tell the author has never paid a hyperscaler’s power bill.
While we’re on commodities: page 65 says that if the world does less than 2°C, IEA scenarios have Australian coal production down 71% and LNG down 68% by 2050. That is the Net Zero book, not the ships. Thermal exports are still around 209 Mt. We remain number one in met coal; India is still lifting imports. Scarborough is 96% built. Shell’s LNG outlook has global demand up about 65% to 2050. Treasury picked the IEA scenario that shrinks the quarry so the “$100 billion green exports” line has room.
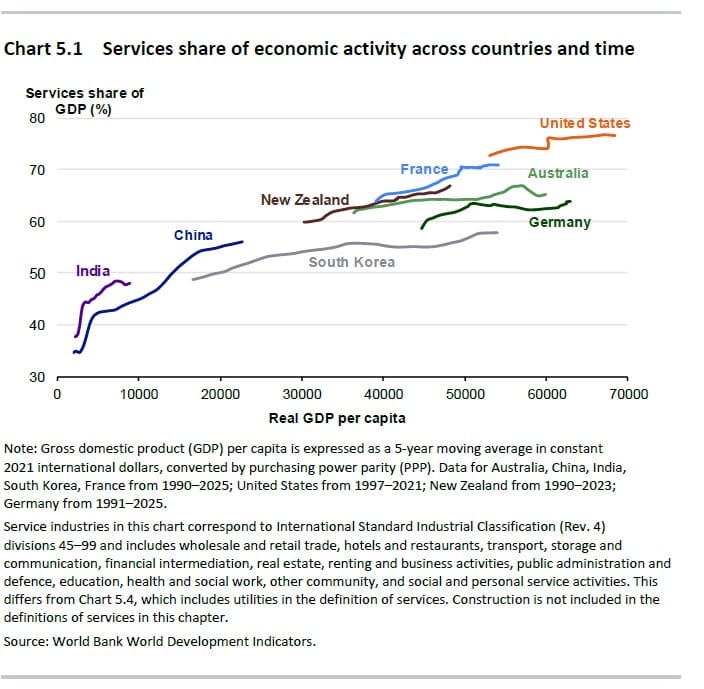
Chapter 5 calls this industrial transformation. Manufacturing is 5.8% of output today. In their upside renewable-exports case it gets all the way to 6.2% by 2050. Resources are still about 58% of exports. Services are about 80% of jobs. We don’t make Reflex anymore — Maryvale’s white paper died in 2023; the blue wrapper now says Thailand. Foreign interests hold about 13% of farmland, and ACCUs pay people to grow trees for credits. “Productivity growth in traded industries will drive change” is a sentence that does not survive their own table.
Chapter 6 is intergenerational equity, which here means tax the stock the old already hold and keep the young on wages, transfers and a bigger state. Home ownership by cohort is falling. From 1 July 2027 the 50% CGT discount dies for new growth: CPI indexation plus a 30% minimum, and if you’re on the top rate that’s 47% on the real gain. It is how you make a ten-year R&D bet look stupid in Australia.
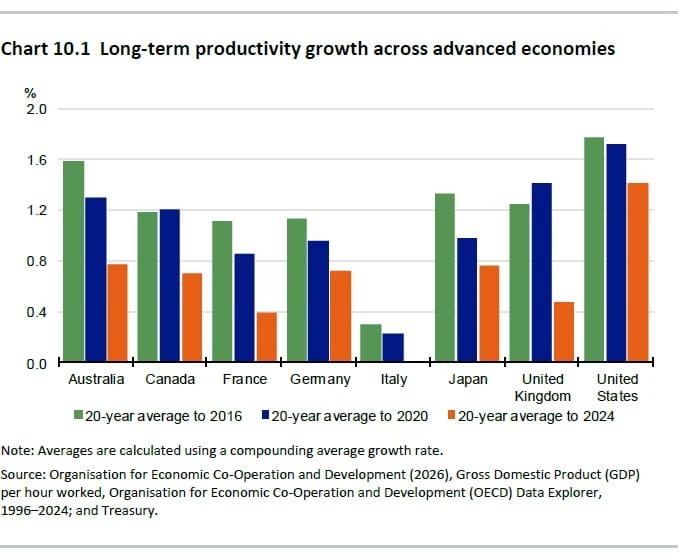
Chapter 10 then assumes labour productivity of 1.2% forever. The Productivity Commission’s September update: −0.2% over the year to June 2026, five-year average −0.5%, and non-market productivity (health, education, public admin) is below March 2007. NDIS weekday charge-out is $73.58 an hour plus $0.99/km and travel time. That’s what the plan is billed, not what the worker pockets — but it’s the price that bids labour away from a workshop. The ASX 200 has compounded about 9–10% a year over a decade. The S&P 500 about 14–15%. Nasdaq-100 more like 18–20%. The sharemarket already voted.
Charts 11.2 and 11.3: underlying cash balance in deficit every year for forty years, 0–1% of GDP for most of it, 1.8% by 2065–66. Receipts flat under a tax cap; payments keep rising. AOFM had $1,016 billion of Commonwealth securities on issue as of 18 September. They never print the 2066 stock in dollars. Convert their own ratios and you get about $4–4½ trillion face value on the official path. If productivity stays sick and the debt ratio looks more like the ~56% sensitivity, you’re in a $6–8 trillion band — $8–9 trillion only if you pin that ratio on an economy that didn’t shrink.
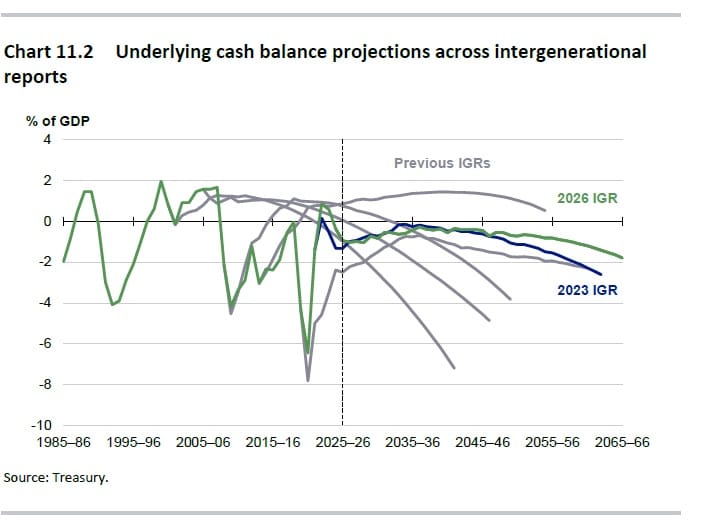
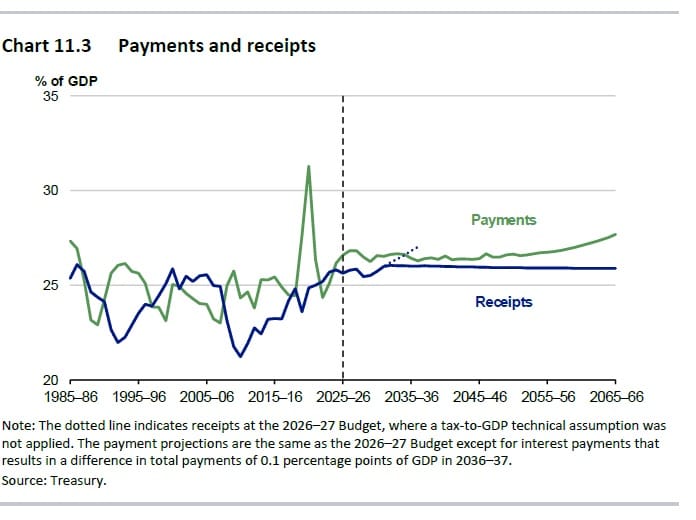
Chart 11.5 says total government debt is “low internationally.” That’s the ankle-deep-shit line. Fall face-first and you’re still covered.
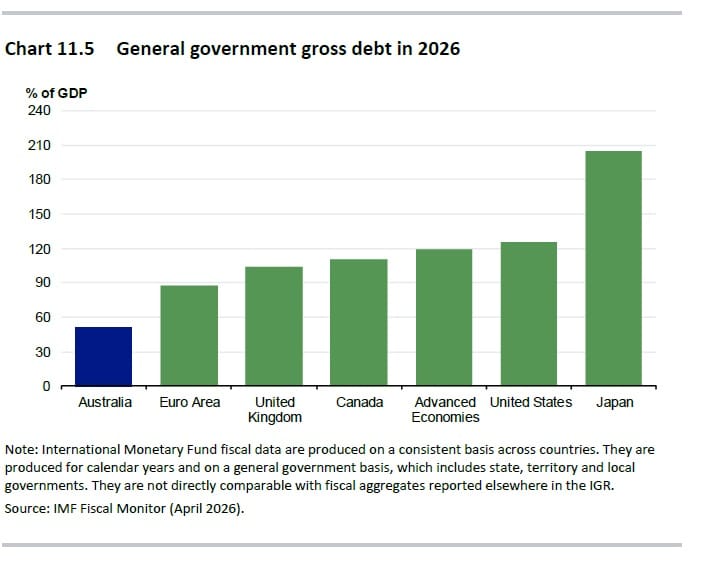
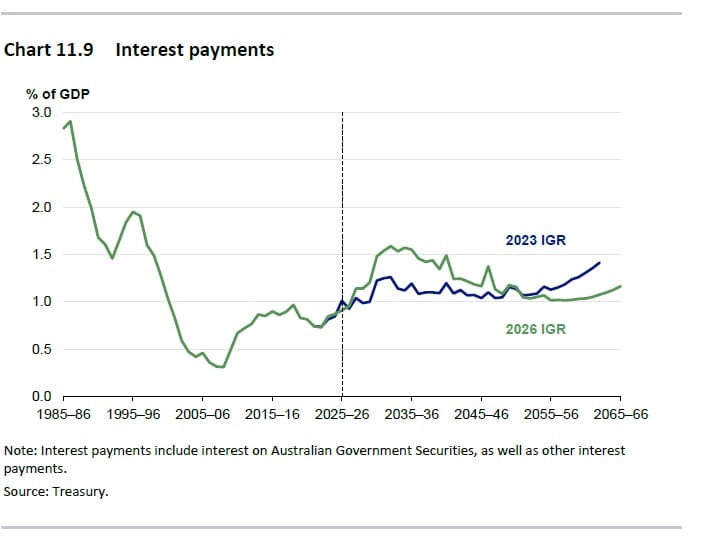
Chart 11.9: interest 0.9% of GDP now, 1.6% by 2032–33, 1.2% in 2066. Doesn’t overtake tax receipts. Does become another automatic program.
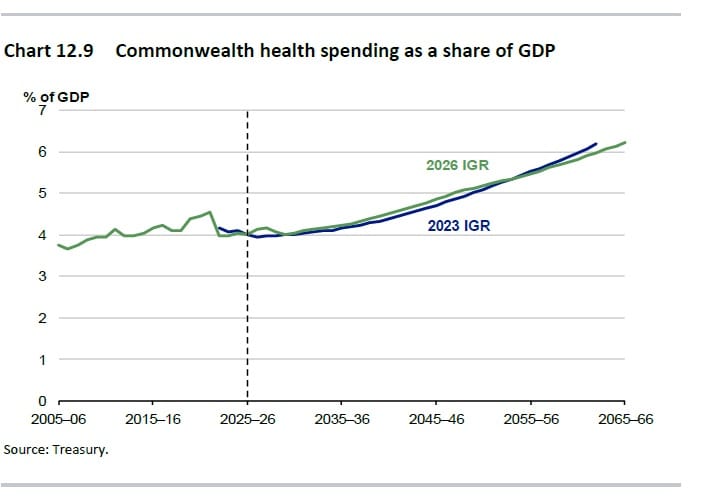
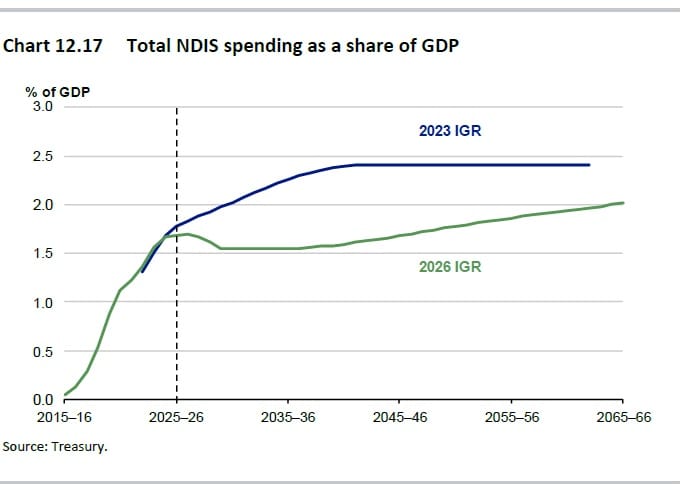
Chapter 12 is spending contained. 26.6% of GDP to 27.7%. Better than the 2023 book, which had +3.8 ppt. Health goes 4.0% → 6.2%. Defence toward 3%. Age Pension the one line that falls (2.3% → 1.8%) because super is supposed to work. NDIS was designed for 411,000 people. There are 782,000+. The savings are a 2028 access change and an 8% growth cap that has not shown up in the participant count. Containment is a press release.
Chapter 13 is the tax nuclear ban.
Chart 13.5: tax receipts capped at the 2005 high of 24.2% of GDP from 2032–33.
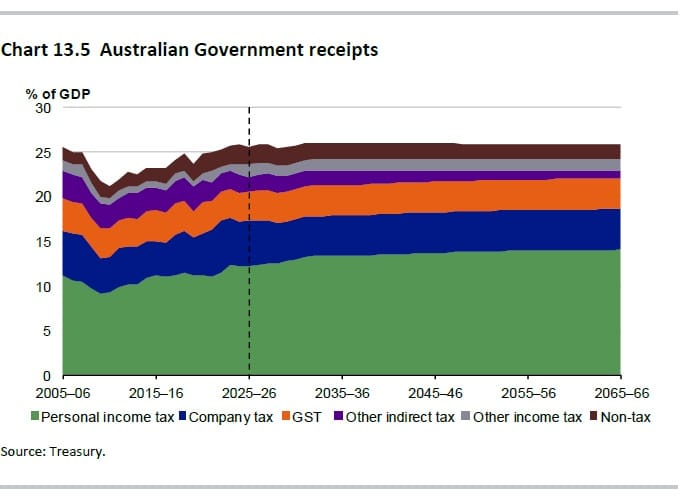
Chart 13.6: composition. Personal income tax is the wedge that fattens. GST and company tax sit still. Fuel and tobacco die. Section 13.2 admits it: tax cuts bend the line for a few years, then personal tax rises to 14.1% of GDP without “further policy change.”
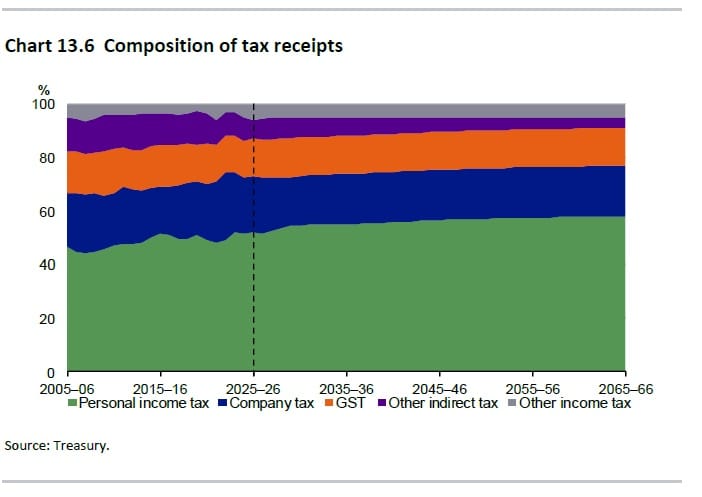
Chart 13.7 is that ever increasing line.
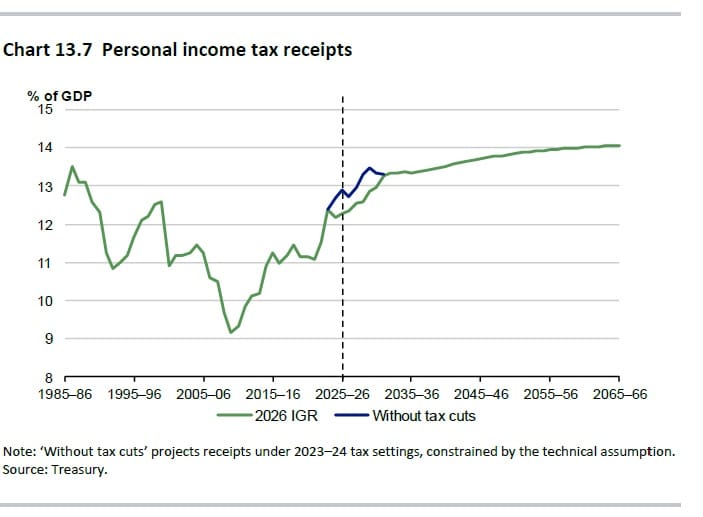
Chart 13.8: company tax 5.0% → 4.6% and parked — commodity prices mean-revert, profit share of GDP assumed constant, 30% rate untouched. A transformation speech with a quarry tax base.
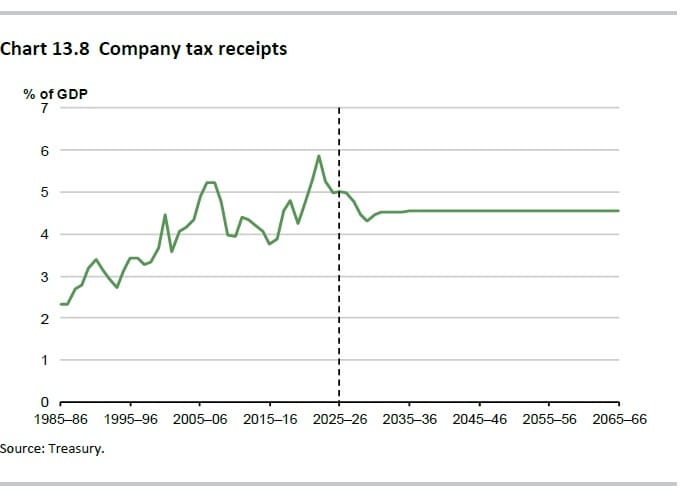
Chart 13.10: GST 3.2% → 3.4% then a ruler line for forty years. The one tax that scales with spending, including tourists and students buying lunch, frozen — while they note ageing will push more consumption into GST-free care. Foreign degrees are GST-free too. Of course they are.
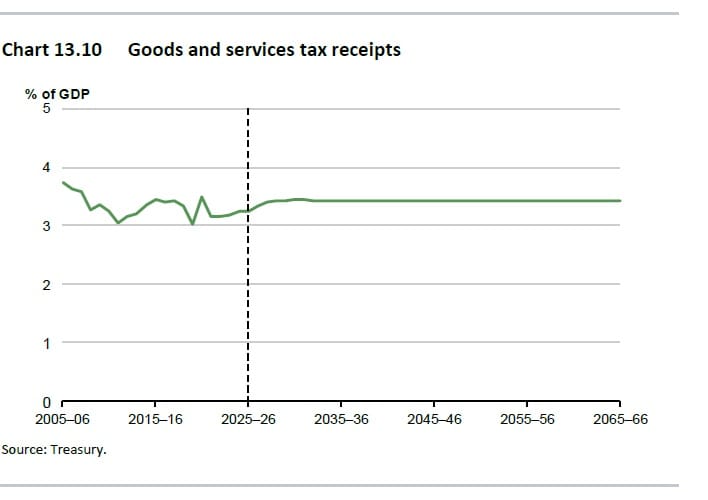
Same move as the reactor. Don’t put GST at 15% or a broader base in the box. Don’t put nuclear in the energy mix. Then point at the leftover chart and call it the only path.
Side note while we’re in the real economy, not 2066. Since Albanese was sworn in (23 May 2022) the RBA has raised the cash rate fifteen times on his watch. Three cuts in 2025. Then three more hikes in 2026 back to 4.35%. Next meeting is Tuesday 29 September. All four majors are now on a 25 bp lift to 4.60%; markets have it about 85–90% priced.
If you only look at one page, look at Chart 3.2 next to Chart 13.6. Weather for power. Wages for tax. Everything else is footnotes.
Rgds
Andy
This information contains unsolicited general information only, without regard to any individual’s investment objectives, financial situation or needs. It is not specific advice for any particular investor or trader. Investment in the stock market involves risk.
This information may not take into account your investment objectives or financial situation, and you should obtain advice based on your own individual circumstances before making an investment decision.
This information is made available to you by ANDIKA Pty Ltd ABN 41 117 403 326, a licensed securities and derivatives dealer (AFSL # 297069).

A global fuel shortage could hand governments the keys to your daily life.

Alex Antic’s grassroots victory offers the Liberals a lifeline, but overturning it would turn renewal into revolt.

When the Senate protects unaccountable power, the government must turn off the money.

Power must return to those whom the Australian people can remove.
Join 50K+ readers of the no spin Weekly Dose of Common Sense email. It's FREE and published every Wednesday since 2009