Weekend Open Forum
Add some joy to your weekend by having a chat with the Confidential community.
Nvidia Plunge Continues while Bitcoin Golden Cross is Confirmed

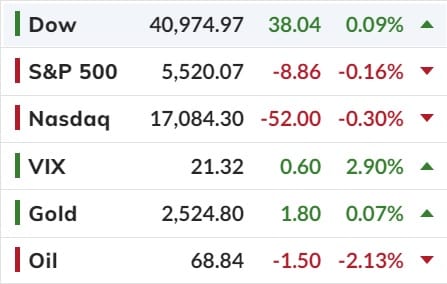
If yesterday's US market dump was a bang, overnight continued selling more of a whimper.
One day after the biggest drop in the S&P since the August 5 rout (which however was followed by a just as violent episode of BTFD) today stocks saw continued selling, with what little interest to buy the dip emerged promptly faded right around the time Europe closed for trading, prompting renewed if more gradual selling, which has pushed the S&P down 0.3%, a far cry from yesterday's 2% dump.

Yesterday's record plunge in NVDA only became bigger, as the stock lost another 2%, pushing it below both 100DMA (after it tripped the 50DMA yesterday) and bringing the two-day drop to 11.4%, or a massive $333 billion loss in market cap in two days. Yes, Nvidia has lost a third of a trillion in the past two days.
If this isn't insanity then I don't know what is. Nvidia's market cap fell USD$279 billion yesterday, the largest single-day decline for any company in history. That's bigger than the market cap of 474 companies in the S&P 500.
Finally, a glimmer of technical help coming to Bitcoin?
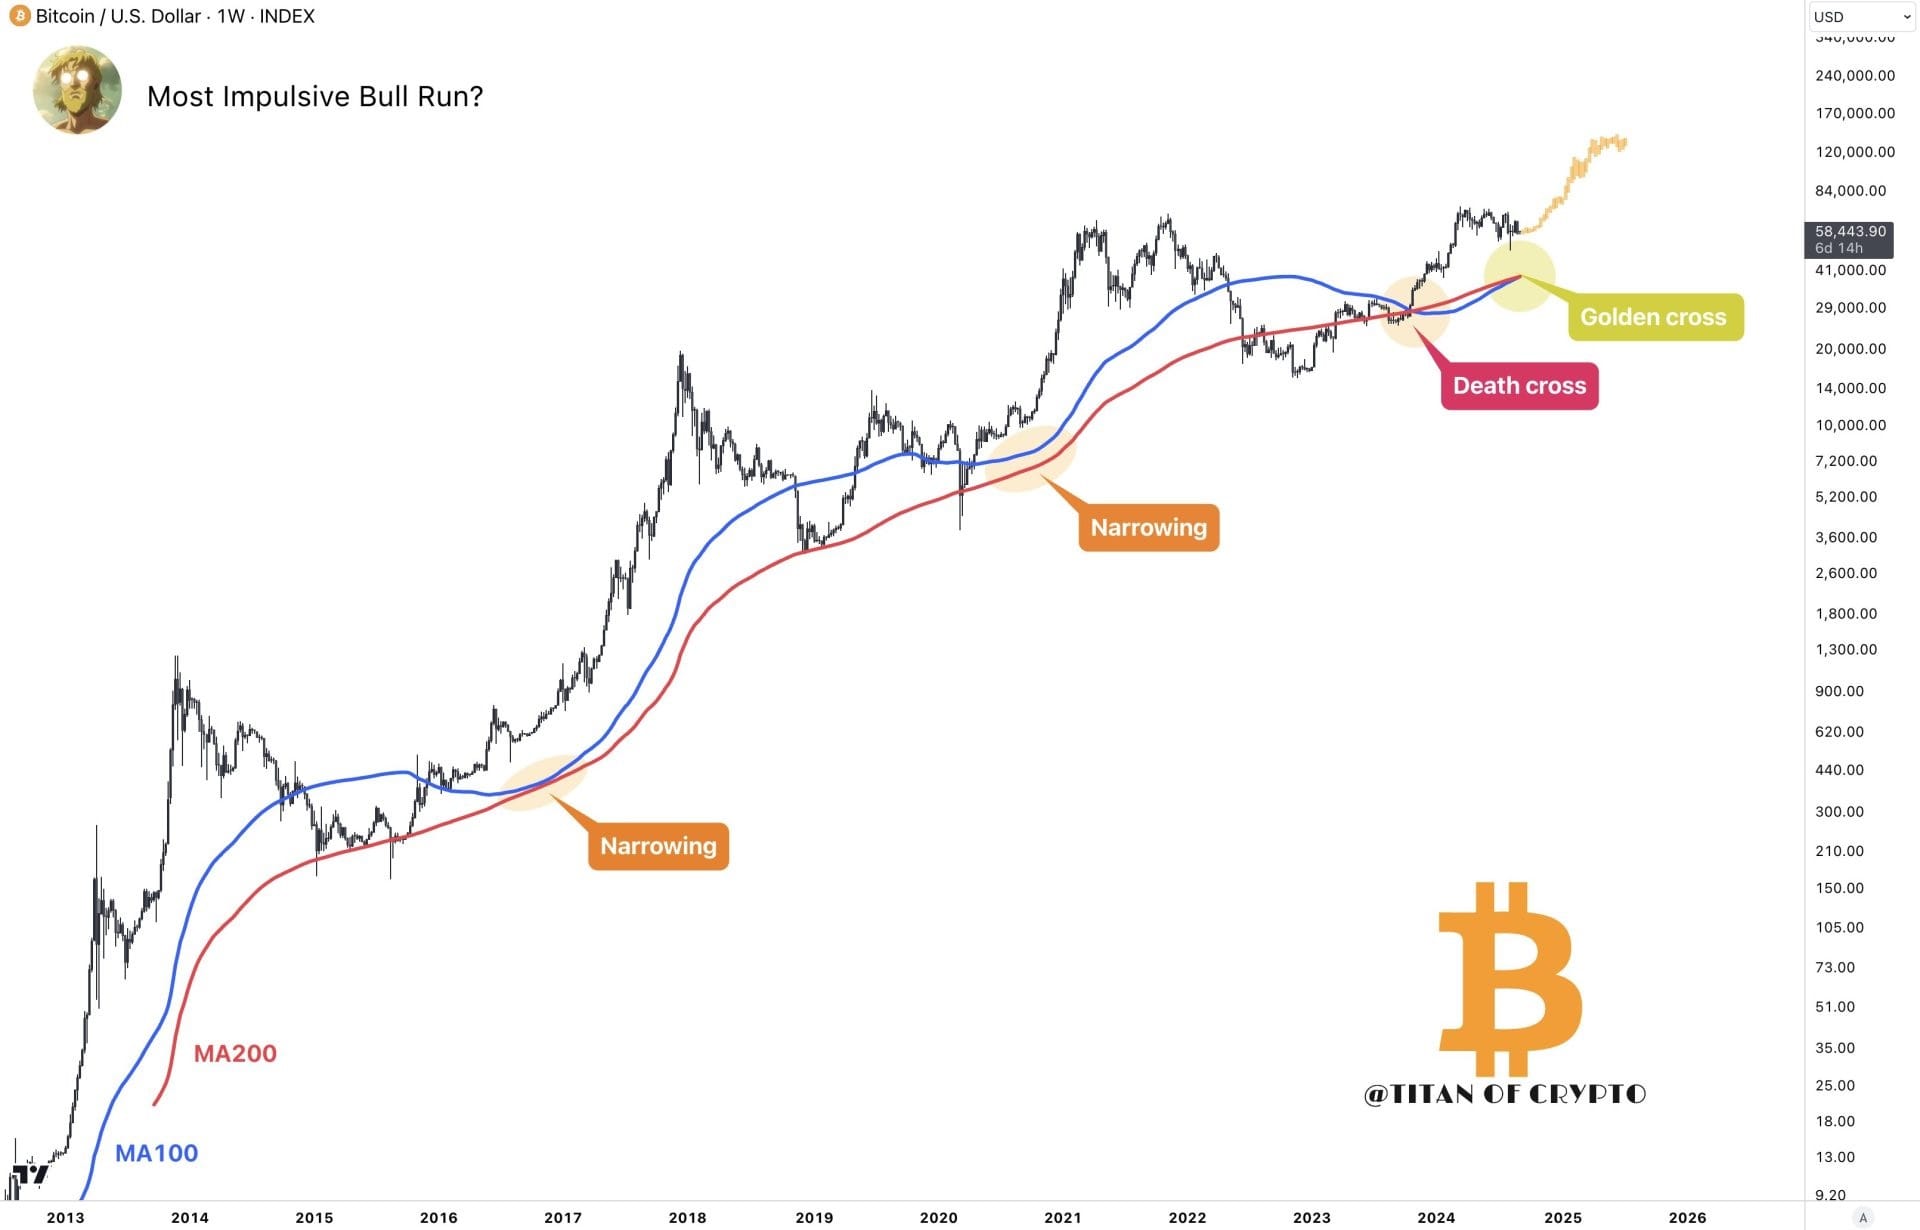
Recently, a prominent crypto investor and technical analyst, known as “Titan of Crypto,” shared an intriguing analysis on Twitter, highlighting a significant development in Bitcoin’s price chart.

The tweet, accompanied by a detailed chart above, underscores the occurrence of a “Golden Cross” between the 100-day (MA100) and 200-day (MA200) moving averages. As Titan of Crypto suggests, this event could herald one of the most substantial bull runs in Bitcoin’s history.
The term “Golden Cross” is a widely recognized concept in technical analysis, referring to a bullish signal that occurs when a short-term moving average crosses above a long-term moving average. In this specific context, the Golden Cross refers to the MA100 (short-term) crossing above the MA200 (long-term) on Bitcoin’s price chart.
Historically, this pattern has been interpreted by traders and analysts as a strong indication of a potential upward price movement, signaling the transition from a bearish or neutral phase into a more optimistic, bullish outlook.
Maybe.
Happy Thursday

This information contains unsolicited general information only, without regard to any individual’s investment objectives, financial situation or needs. It is not specific advice for any particular investor or trader. Investment in the stock market involves risk.
This information may not take into account your investment objectives or financial situation, and you should obtain advice based on your own individual circumstances before making an investment decision.
This information is made available to you by ANDIKA Pty Ltd ABN 41 117 403 326, a licensed securities and derivatives dealer (AFSL # 297069).